Welcome! The Meters of Greek Drama database is an ongoing project of the Department of Classics and the Humanities Digital Workshop at Washington University in St. Louis. Its aim is to compile the metrical information present in a growing list of Ancient Greek plays, so that the plays can be read with scansion, and so that students, scholars, dramaturgs, and performers can both see easily the metrical patterns of each play and discover statistical patterns in the use of meter throughout the corpus of Greek drama.
The database is being created by the following team:
Principal Investigator: Timothy J. Moore, Washington University in St. Louis
Staff, Humanities Digital Workshop, Washington University in St. Louis: Douglas W. Knox and Stephen Pentecost
Student Assistants, Washington University in St. Louis: Jacqueline Baik, Ariadne Bazigos, Emma Bunde, Zixing Chen, Max Coady, Jordan Coley, Will Corbin, Shangwei Deng, Shawn Duan, Lucas Dube, Emelyn Hatch, Petey Kraemer, Lydia McKelvie, Jennifer McLish, Ian McNeely, Zakery Oglesby, Henry Schott, Elena Steiert, Tumaini Ussiri, Di Wang.
Consultant: Anna Conser, University of Cincinnati
How to use the database
The easiest way to learn how the database operates is to begin using it. Start with the interface and then tinker with the statistics. Afterwards, it will be useful to read about the more specific features of the website.
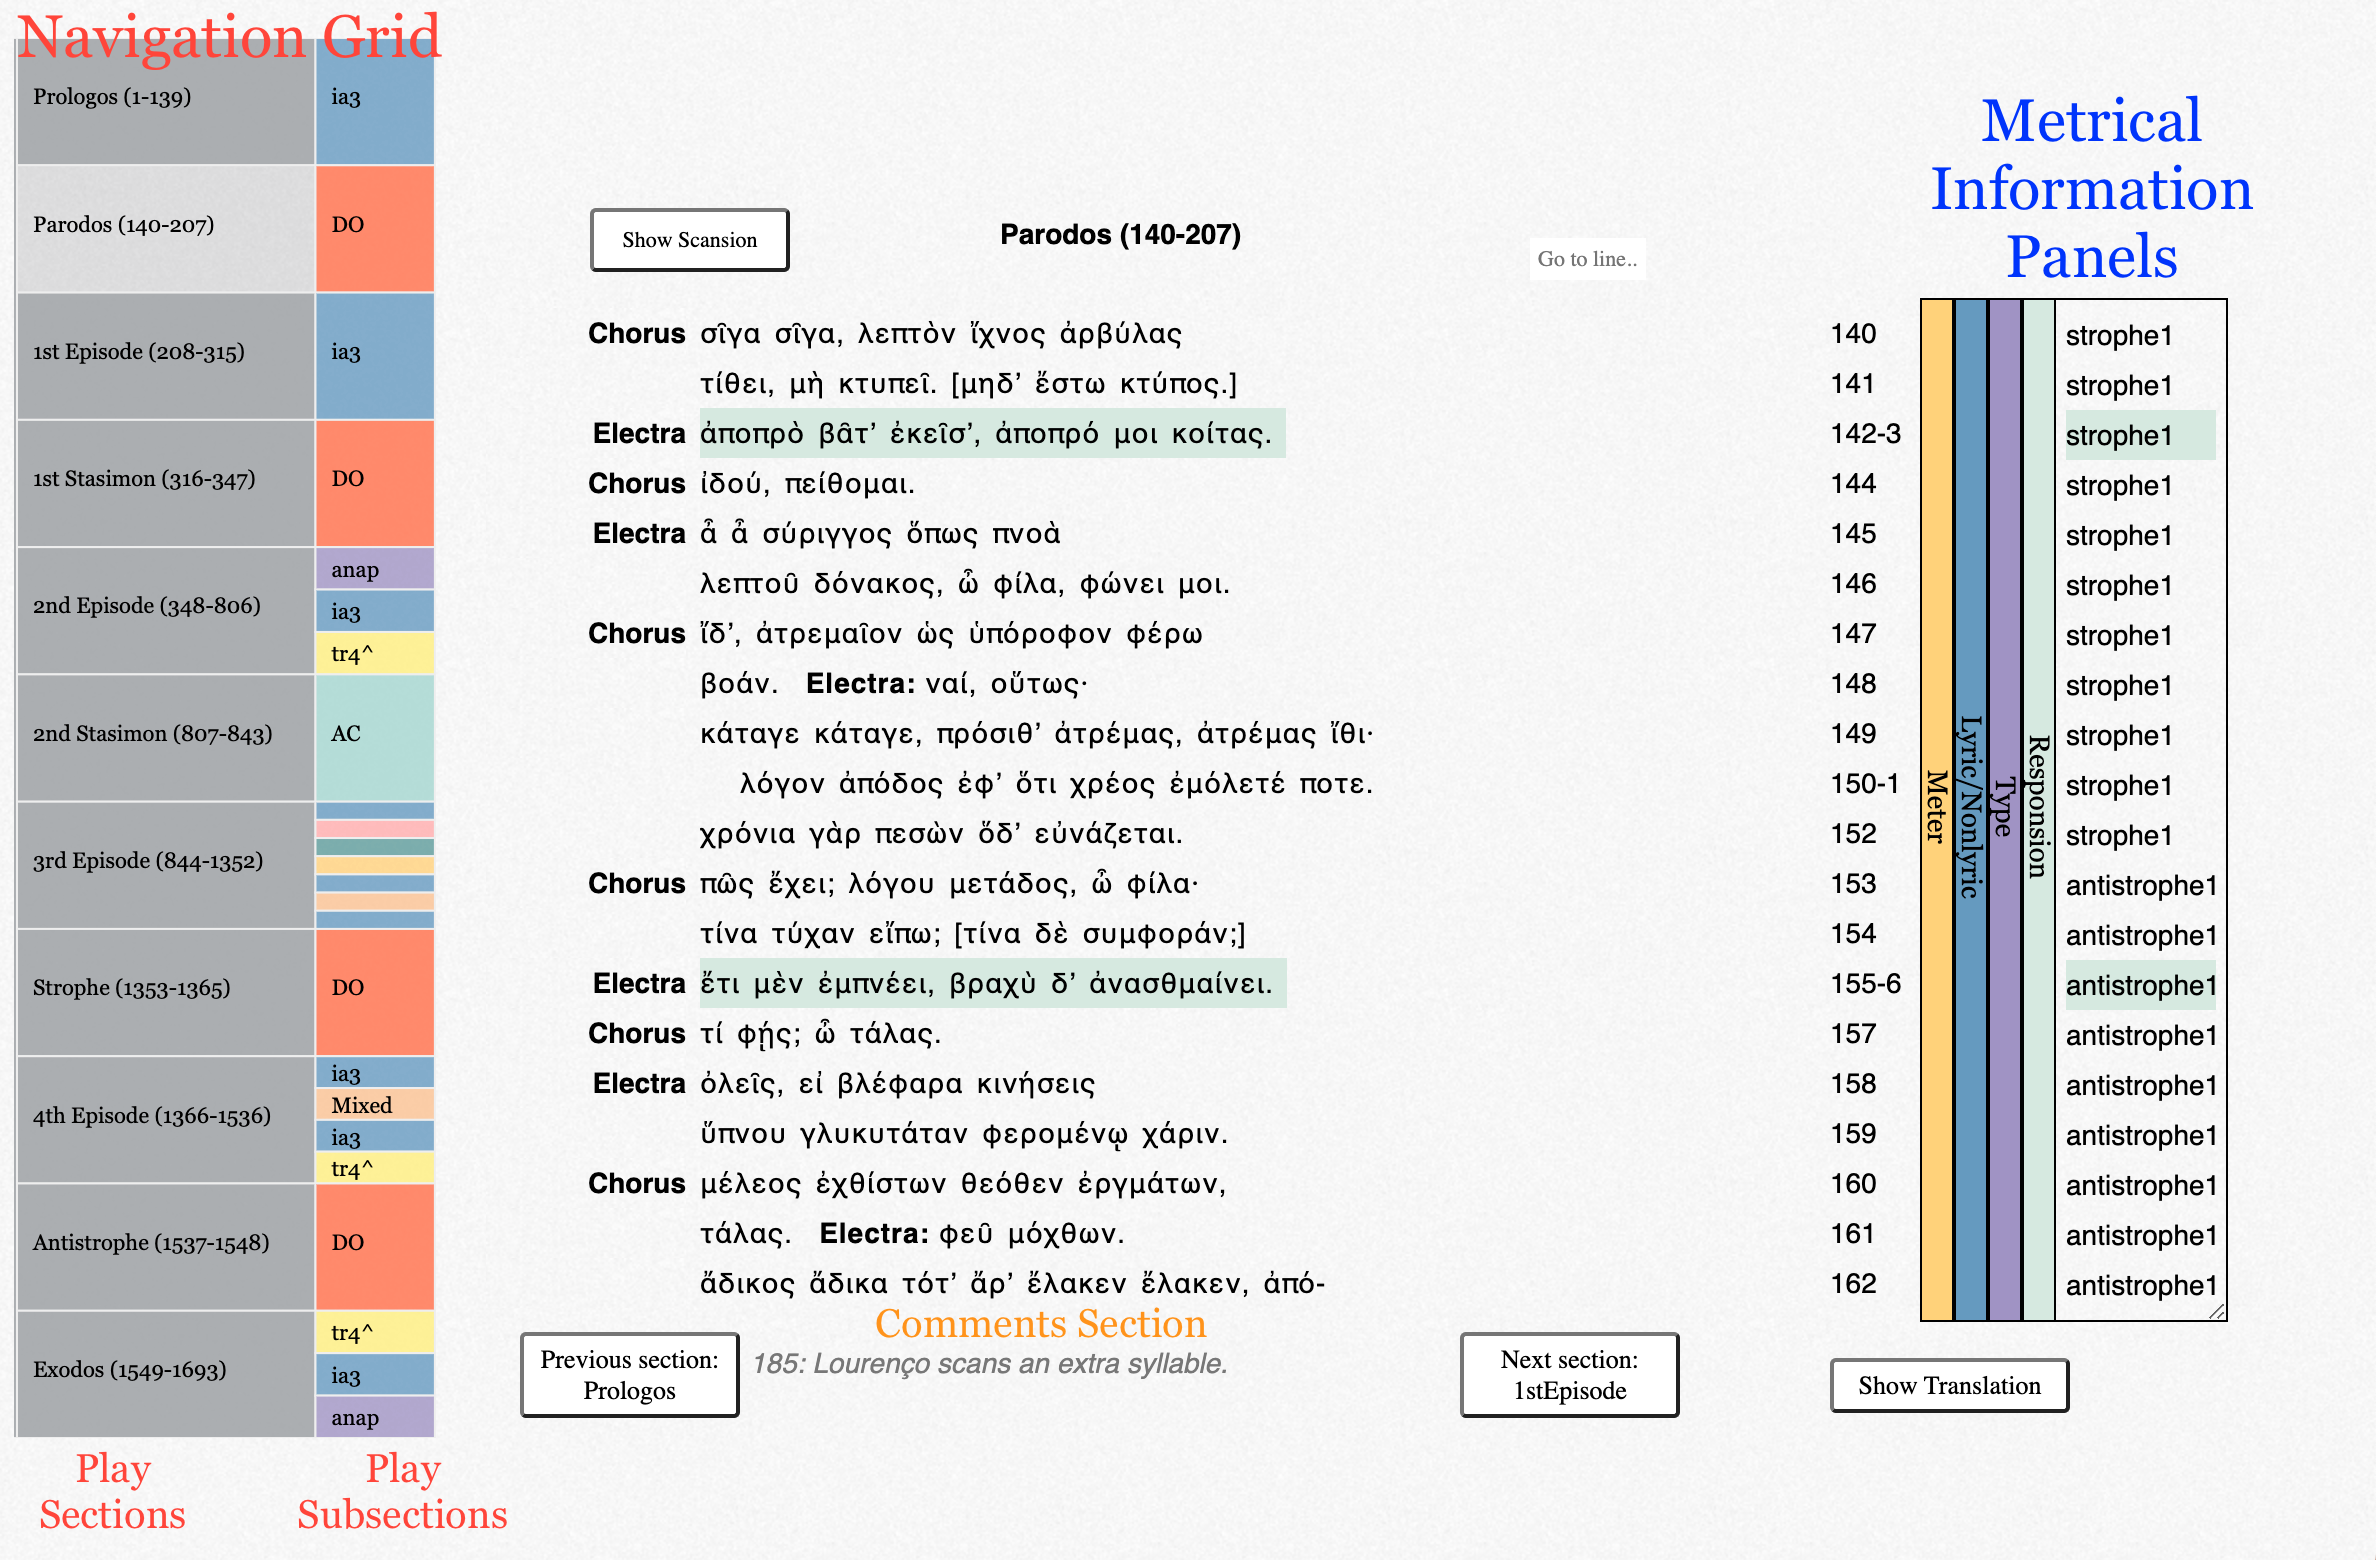
A screenshot of the interface with terminology
Navigation Grid
Clicking on any of the play sections on the navigation grid will load that section onto the body of the interface. That play section will also expand so that its multicolored subsections can be more clearly seen. Clicking on it again will shrink the navigation grid back to its original state.
The play section is further divided into play subsections, represented by multicolored boxes, on the basis of changes in meter or type of meter. Clicking on a play subsection will lead to that portion of the text, which will be highlighted in grey.
Note: Heftier sections of the play may take a while (three to five seconds) to load.
Scansion
To display the scansion of the text, click the button titled "Show Scansion". On the top of each syllable will appear a scansion symbol marking it as long (-), short (∪), or "brevis in longo" (∩) in length. Symbols indicating metra (|), ends of periods (||), synapheia (∫), and caesurae (//) will occasionally appear as well. To hide the scansion, click the same button, now titled "Hide Scansion".
Search
The box labelled "Go to line..." allows access to any line in the play. Click on it, enter a valid line number, and hit Enter or Return. The text box will switch to the section that contains the line and jump down to that line. The line will also be highlighted.
Metrical Information Panels
The panels to the side of the text box contain metrical information about each
line of the text. Clicking one of the panels will expand or hide it.
Play sections display the Responsion panel if they have responding stanzas.
Clicking any of the 'strophe' labels in the Responsion panel will highlight in teal-green the line and the corresponding line in the antistrophe—and vice versa for the 'antistrophe' labels.
Translations
Translations can be toggled by clicking the "Show Translation" button underneath the metrical information panels. Every fifth line of the play is marked in square brackets in the translation. Entering a line number in the "Go to line" box when the translation is displayed will jump the translation to the closest fifth line before it.
Comments
Comments will occasionally appear in grey italics below the text in a comments section. For play sections with much to comment about, the comments section may be scrollable.
How to use the Filters and Statistics Page
The purpose of the Filters and Statistics page is to quantify the text in the database based on different attributes.
Filters
When first entering the Filters and Statistics page, no filters will be active. Every line from every play represented in the database will be counted towards the statistics. Selecting one or more filters from the Filters box and then clicking the "Apply Filters" button on the bottom will update the statistics in the expected manner.
Metrical Patterns
On the top of the filters box, you will notice the section entitled "Metrical Pattern", whose buttons you can click to type out a particular scansion to filter for. The markings are long (-), short (∪), short or long (⏓), two shorts or a long (⏕), and "brevis in longo" (∩).
Notes:
The ∪ marking does not include brevis in longo in its accounting.
The ⏓ marking will filter for any short syllable, long syllable, or brevis in longo (not two short syllables). It is not dependent upon metrical position.
The ⏕ marking will filter for any long syllable or two consecutive short syllables. It is not dependent upon metrical position.
You can use any valid "regular expression" (or "regex") as a metrical pattern by typing directly in the box. The following are some of the more useful regex expressions for this context:
Symbol
Meaning
Example
Explanation
^
Marks the start of the line/word
^-
Returns every line/word that starts with a long syllable
$
Marks the end of the line/word
∪$
Returns every line/word that ends with a short syllable
|
Matches the EITHER expression before OR after the pipe (within parentheses)
(∪∪∪|-)-
Returns every line/word that contains either three shorts or a long and then a subsequent long syllable
When quantifying data by words, the metrical pattern filter will match for the meter within each word. However, the metrical pattern filter is disabled when quantifying data by syllables.
The Rest of the Filters Box
Basic instructions on how to operate the filters are on the left side of the Statistics page.
There are multiple dimensions of filtering possible, whether by Gender or Line Meter. The basic idea is that all of the individual filters within a specific dimension are mutually exclusive—e.g., you can't have a line spoken by a simultaneously free and enslaved character; each line can only have one meter typing.
Note the presence of the "Select all" and "Deselect all" buttons as well as the Search box, which operate in the expected fashion. Additionally, you can order the various filters either in alphabetical order or by the number of lines in that filter by clicking on the up/down arrows on the table headers.
Statistics
The statistics box contains representations of the data filtered in the filters box. There are five tabs corresponding to these different representations.
All Lines
In this tab, you can scroll through the specific lines the filters have included. You can click on the text to go to the corresponding line, which will be highlighted in yellow, on the text interface. You can also use this to select specific lines, in the same manner as the other filters; that is, "Apply Filters" will take into account the lines that you choose in this tab.
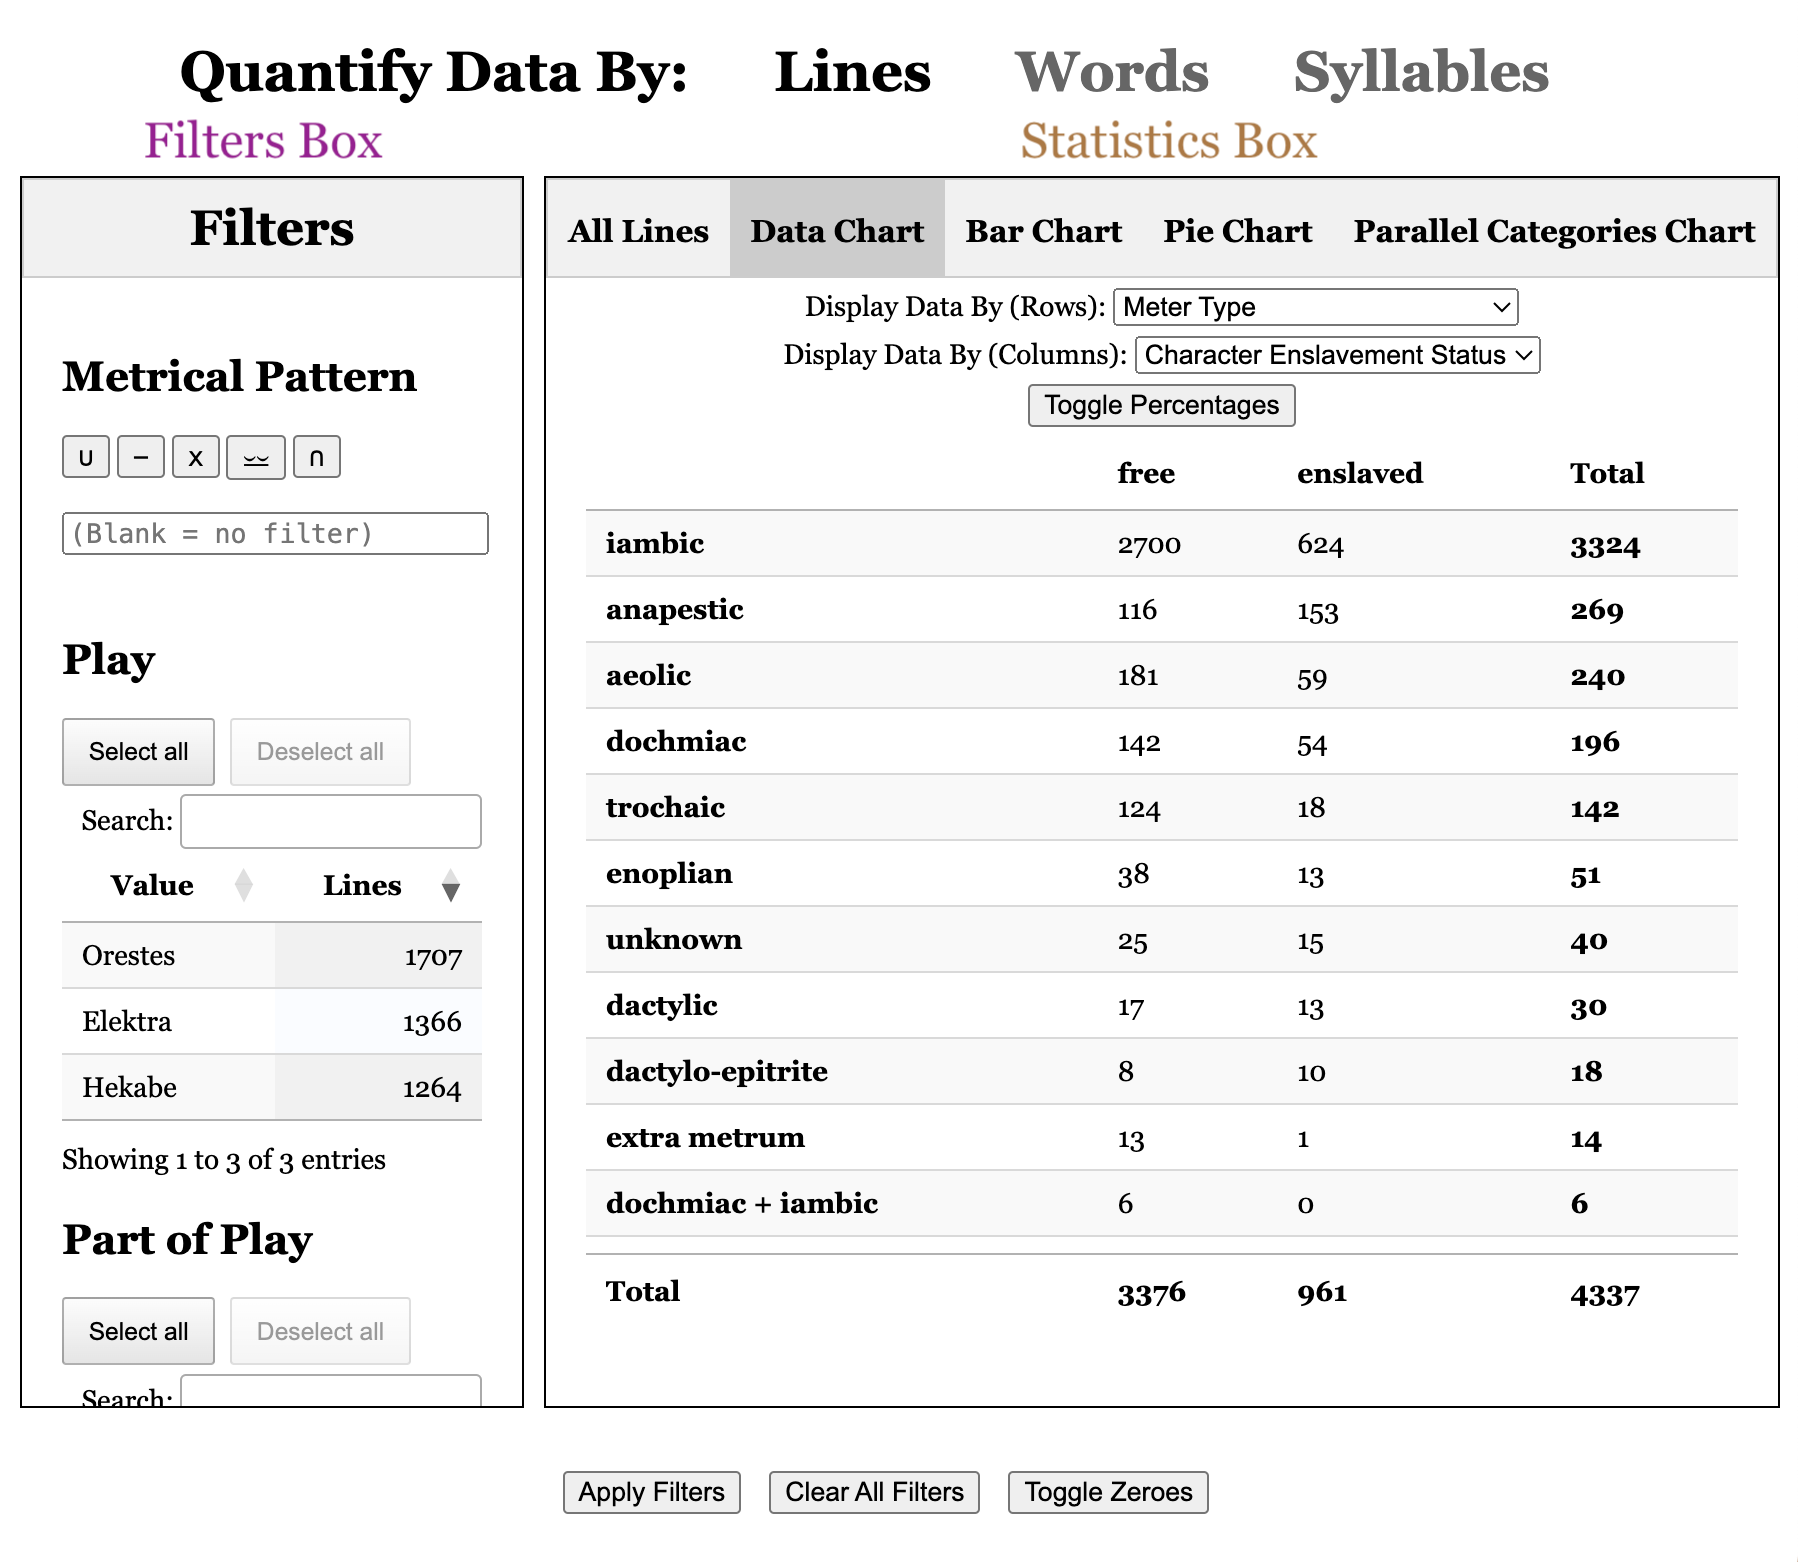
Data Chart
The data chart tabulates the lines (or words or syllables) along two dimensions, as indicated by the dropdown menus on the top. To get the data in only one dimension, set the "Display Data By (Column):" dropdown menu to "None" or match the top and bottom dropdown menus.
When the data chart is in two dimensions, the "Toggle Percentage" button will cycle through four different ways of tallying the data.
The default state displays the raw numbers.
The second state calculates the percentage by taking each cell of data and dividing it by the total of that row.
The third state also displays a percentage, but by taking each cell and dividing it by the total of that column.
The fourth and final state takes each cell and divides it by the total of the entire chart—that is, the current total number of (filtered) lines/words/syllables.
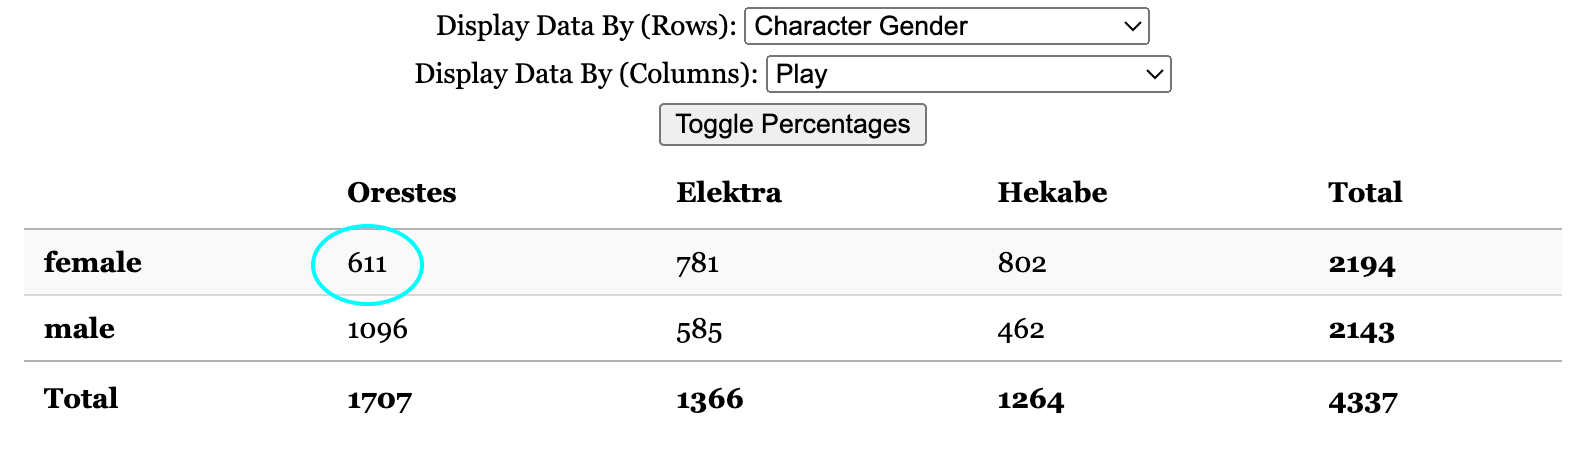
For example, if one were to tally the number of lines by character gender and by play, the table would look something like the following:
Consider the top left cell, the intersection of the "female" and "Orestes" attributes.
The default state shows that 611 lines are spoken by females in the play Orestes.
After pressing "Toggle Percentages," the second state is displayed. The 611 lines originally in the cell is now divided by the total in that row, 2194, to display 27.8%. That is, 27.8% of all lines spoken by a female by any play in the corpus are spoken in Orestes.
After pressing "Toggle Percentages" again, the third state is displayed. The 611 lines originally in the cell is divided by the total in that column, 1707, to display 35.8%. That is, 35.8% of all lines in Orestes are spoken by a female.
After pressing "Toggle Percentages" a third time, the fourth state is displayed. The 611 lines originally in the cell is divided by the total in the entire chart—4337—to display 14.1%. That is, out of all the lines that are currently being counted—which in this case is the entire corpus—14.1% of them are spoken by a female in the play Orestes.
Pressing "Toggle Percentages" again brings the table back to the default state.
Bar and Pie Charts
These are mostly self-explanatory.
You can save these plots as png files by hovering over them and clicking on the camera icon that pops up. On the bar chart, you can click and drag to zoom in to a specific region that you may want to see closer. Zooming out, panning, and other options are also available in the menu if you hover over the graph.
Parallel Category Chart
The chart displays simultaneously the many dimensions into which the data are categorized. Each vertical grouping of dark blue bars corresponds to a dimension, while each individual bar represents one of the categories within that dimension—these are a subset of the dimensions present in the filters box. On the other hand, each band traverses six bars, one per dimension, and represents a group of lines that possesses all of those specific attributes.
If the chart looks odd, try increasing the vertical size of the window.
Remember that you can set filters in the Filters box, which will change the data presented in the chart in accordance with the filters.
Quantify Data By
You can choose the units of measurement that the website uses to tally the data by clicking any of the three links on the top of the page. Because lines can vary wildly by length, assigning each line the same statistical value may not be the most informative way to organize the data. Computing words and syllables, however, is significantly slower than tallying lines due to the increased precision of the measurement method.
Toggle Zeroes
You can use this button to make the filters and any of the statistical displays hide (or show) categories that are empty for the sake of visual clarity. This button does not affect the Line Text tab, which will always hide lines that are excluded by active filters.
About the site
This site was built using javascript and the d3 (Data Driven Documents)
javascript library, version 3. For more information on d3, see
https://d3js.org/
The charts in the statistics section were generated using Vega Lite.
More information about Vega Lite can be found here:
https://vega.github.io/vega-lite/docs/